The “Coimbatore Investors Meetup” took place on 27th July 2025 at Spazeone Coworking Space, Avinashi Road. Hosted at Mr Balasubramanian Rengasamy, the gathering aimed to foster financial awareness and facilitate knowledge sharing among local investors and entrepreneurs through regular, thematic sessions highlighting emerging opportunities and industry trends.
Agenda
📊 Agenda: Stock Ideas & Market Outlook
Stock Ideas (3 picks)
- Company Overview and Business Model of each pick
- Rationale behind selection
- Financial Overview
- Market Position and Industry Context
- Growth Strategy and Capacity Expansion
- Investment Highlights and Valuation
NTPC Green – India’s Solar Story
Company Overview and Business Model
NTPC Green Energy Limited (NGEL) is a wholly owned subsidiary of NTPC Ltd., established in April 2022 to consolidate NTPC’s renewable energy portfolio. NGEL develops, constructs, and operates utility-scale solar and wind power projects under long-term Power Purchase Agreements (PPAs). It also pursues optionality in Battery Energy Storage Systems (BESS) and green hydrogen, leveraging low-cost debt and sovereign credibility from its ‘AAA’-rated parent. With a visible pipeline of over 19 GW by FY 2027 and a target of 60 GW by FY 2032, NGEL aims to be a leading player in India’s transition to 500 GW of non-fossil energy by 2030.
Financial Overview
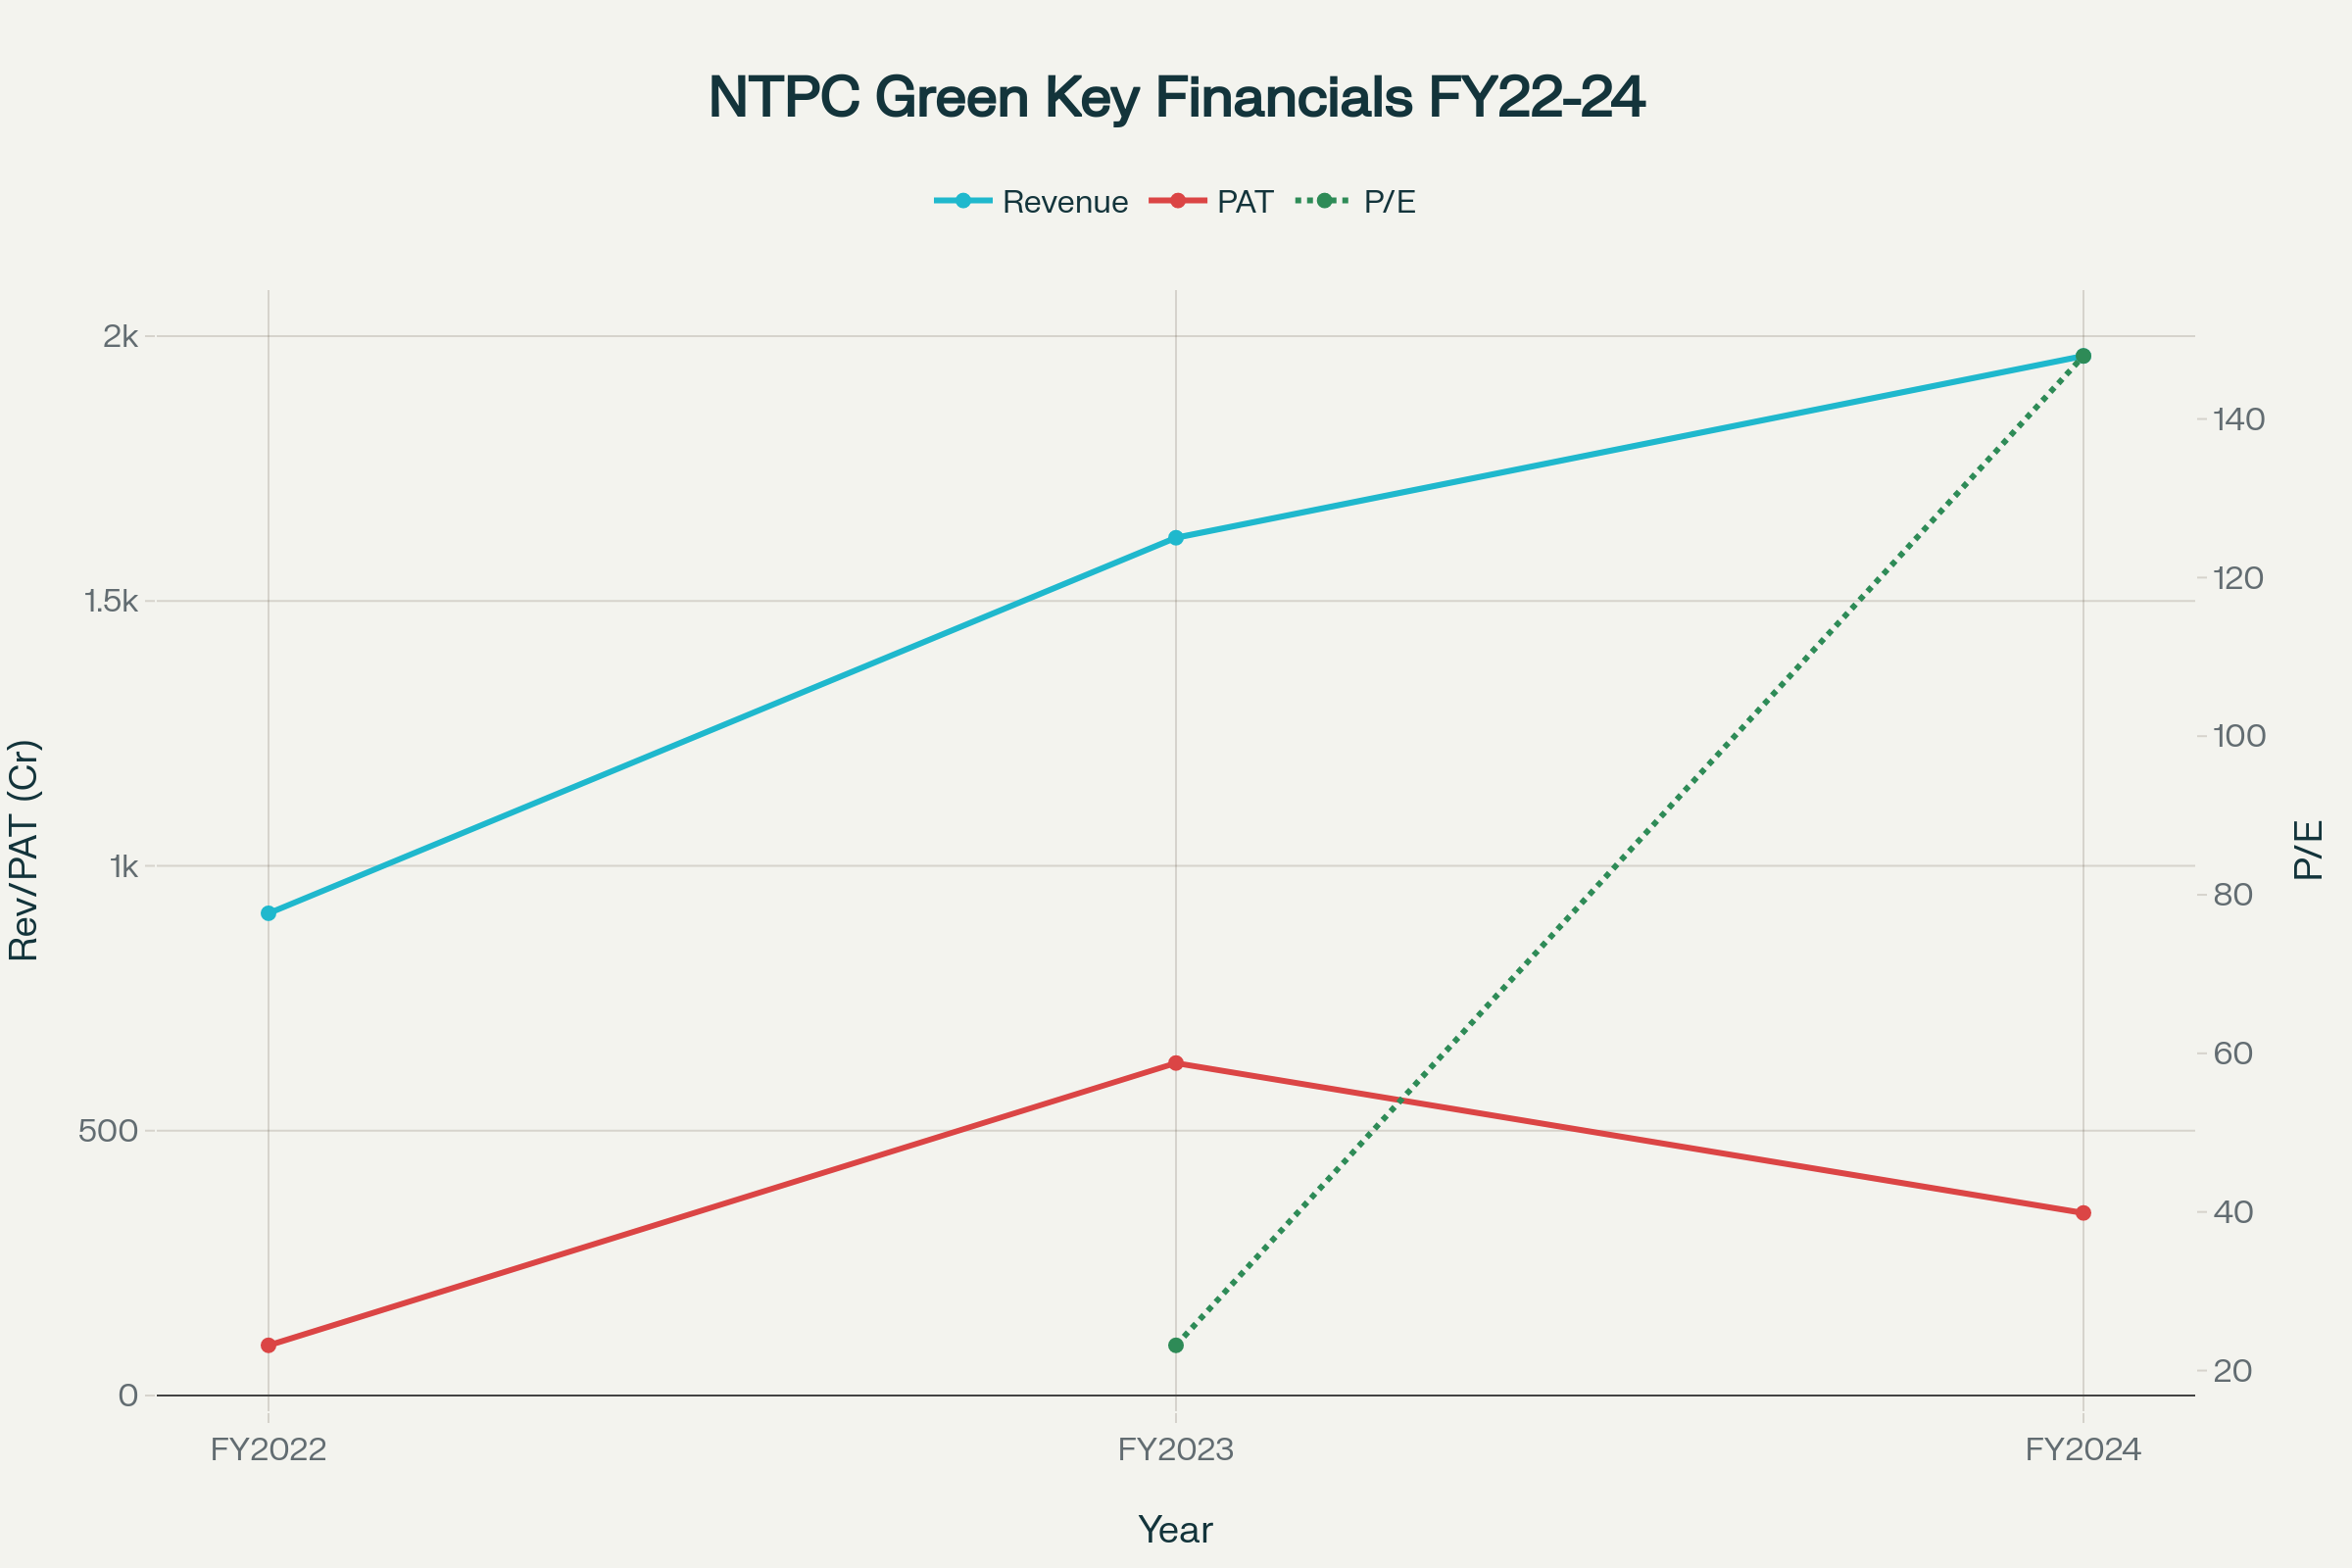
NTPC Green Energy: Revenue, PAT, and P/E Ratio (FY2022–FY2024)
Figure 1: NTPC Green Energy – Revenue, PAT, and P/E Ratio (FY 2022–FY 2024)
| Fiscal Year | Revenue (₹ Cr) | PAT (₹ Cr) | P/E (x) |
|---|---|---|---|
| FY 2022 | 910.42 | 94.74 | – |
| FY 2023 | 1619.40 | 627.72 | 23.18 |
| FY 2024 | 1962.60 | 344.72 | 147.95 |
Market Position and Industry Context
India targets 500 GW of non-fossil capacity by 2030, including ~300 GW of solar. NGEL, with an operational base of 6.8 GW and 11.8 GW under construction, ranks among the top five renewable IPPs in India. Its parent-backed funding, long-term PPAs, and JV pacts (e.g., 10 GW parks with MAHAPREIT) position it strongly amid a sector projected to add ~180–190 GW of renewable capacity from FY 2025 to FY 2029.
Growth Strategy and Capacity Expansion
- Organic and Inorganic Growth: Ramp-up plan of 3 GW, 5 GW, and 8 GW over FY 2025–27, with visibility to 19 GW by FY 2027.
- Diversification: Expansion into BESS and green hydrogen.
- Strategic MoUs: Land and resource agreements with state governments and PSUs (e.g., Indian Oil, ONGC).
Investment Highlights and Valuation
- Strong Backing: Wholly owned by NTPC Ltd., with ₹75 000 Cr of capital infused.
- Locked-in Revenue: 25-year PPAs mitigate counterparty risk.
- Attractive Growth: 63% revenue CAGR FY 2022–24; improving execution efficiency led to Q4 FY 2025 PAT growth of 188% YoY.
- Valuation: Current P/E ~188x reflecting high-growth enterprise value.
Aurionpro Solutions Limited
Company Overview and Business Model
Aurionpro Solutions is an IT services firm offering end-to-end logistics, smart mobility, banking, and enterprise AI solutions. Its key platforms include digital freight booking, transit payment systems, and Prism/Apex Enterprise AI suites. The company leverages deep banking fintech expertise to cross-sell AI to existing clients, addressing a ₹ 200 Bn Indian logistics software market growing at 12–15% CAGR.
Financial Overview
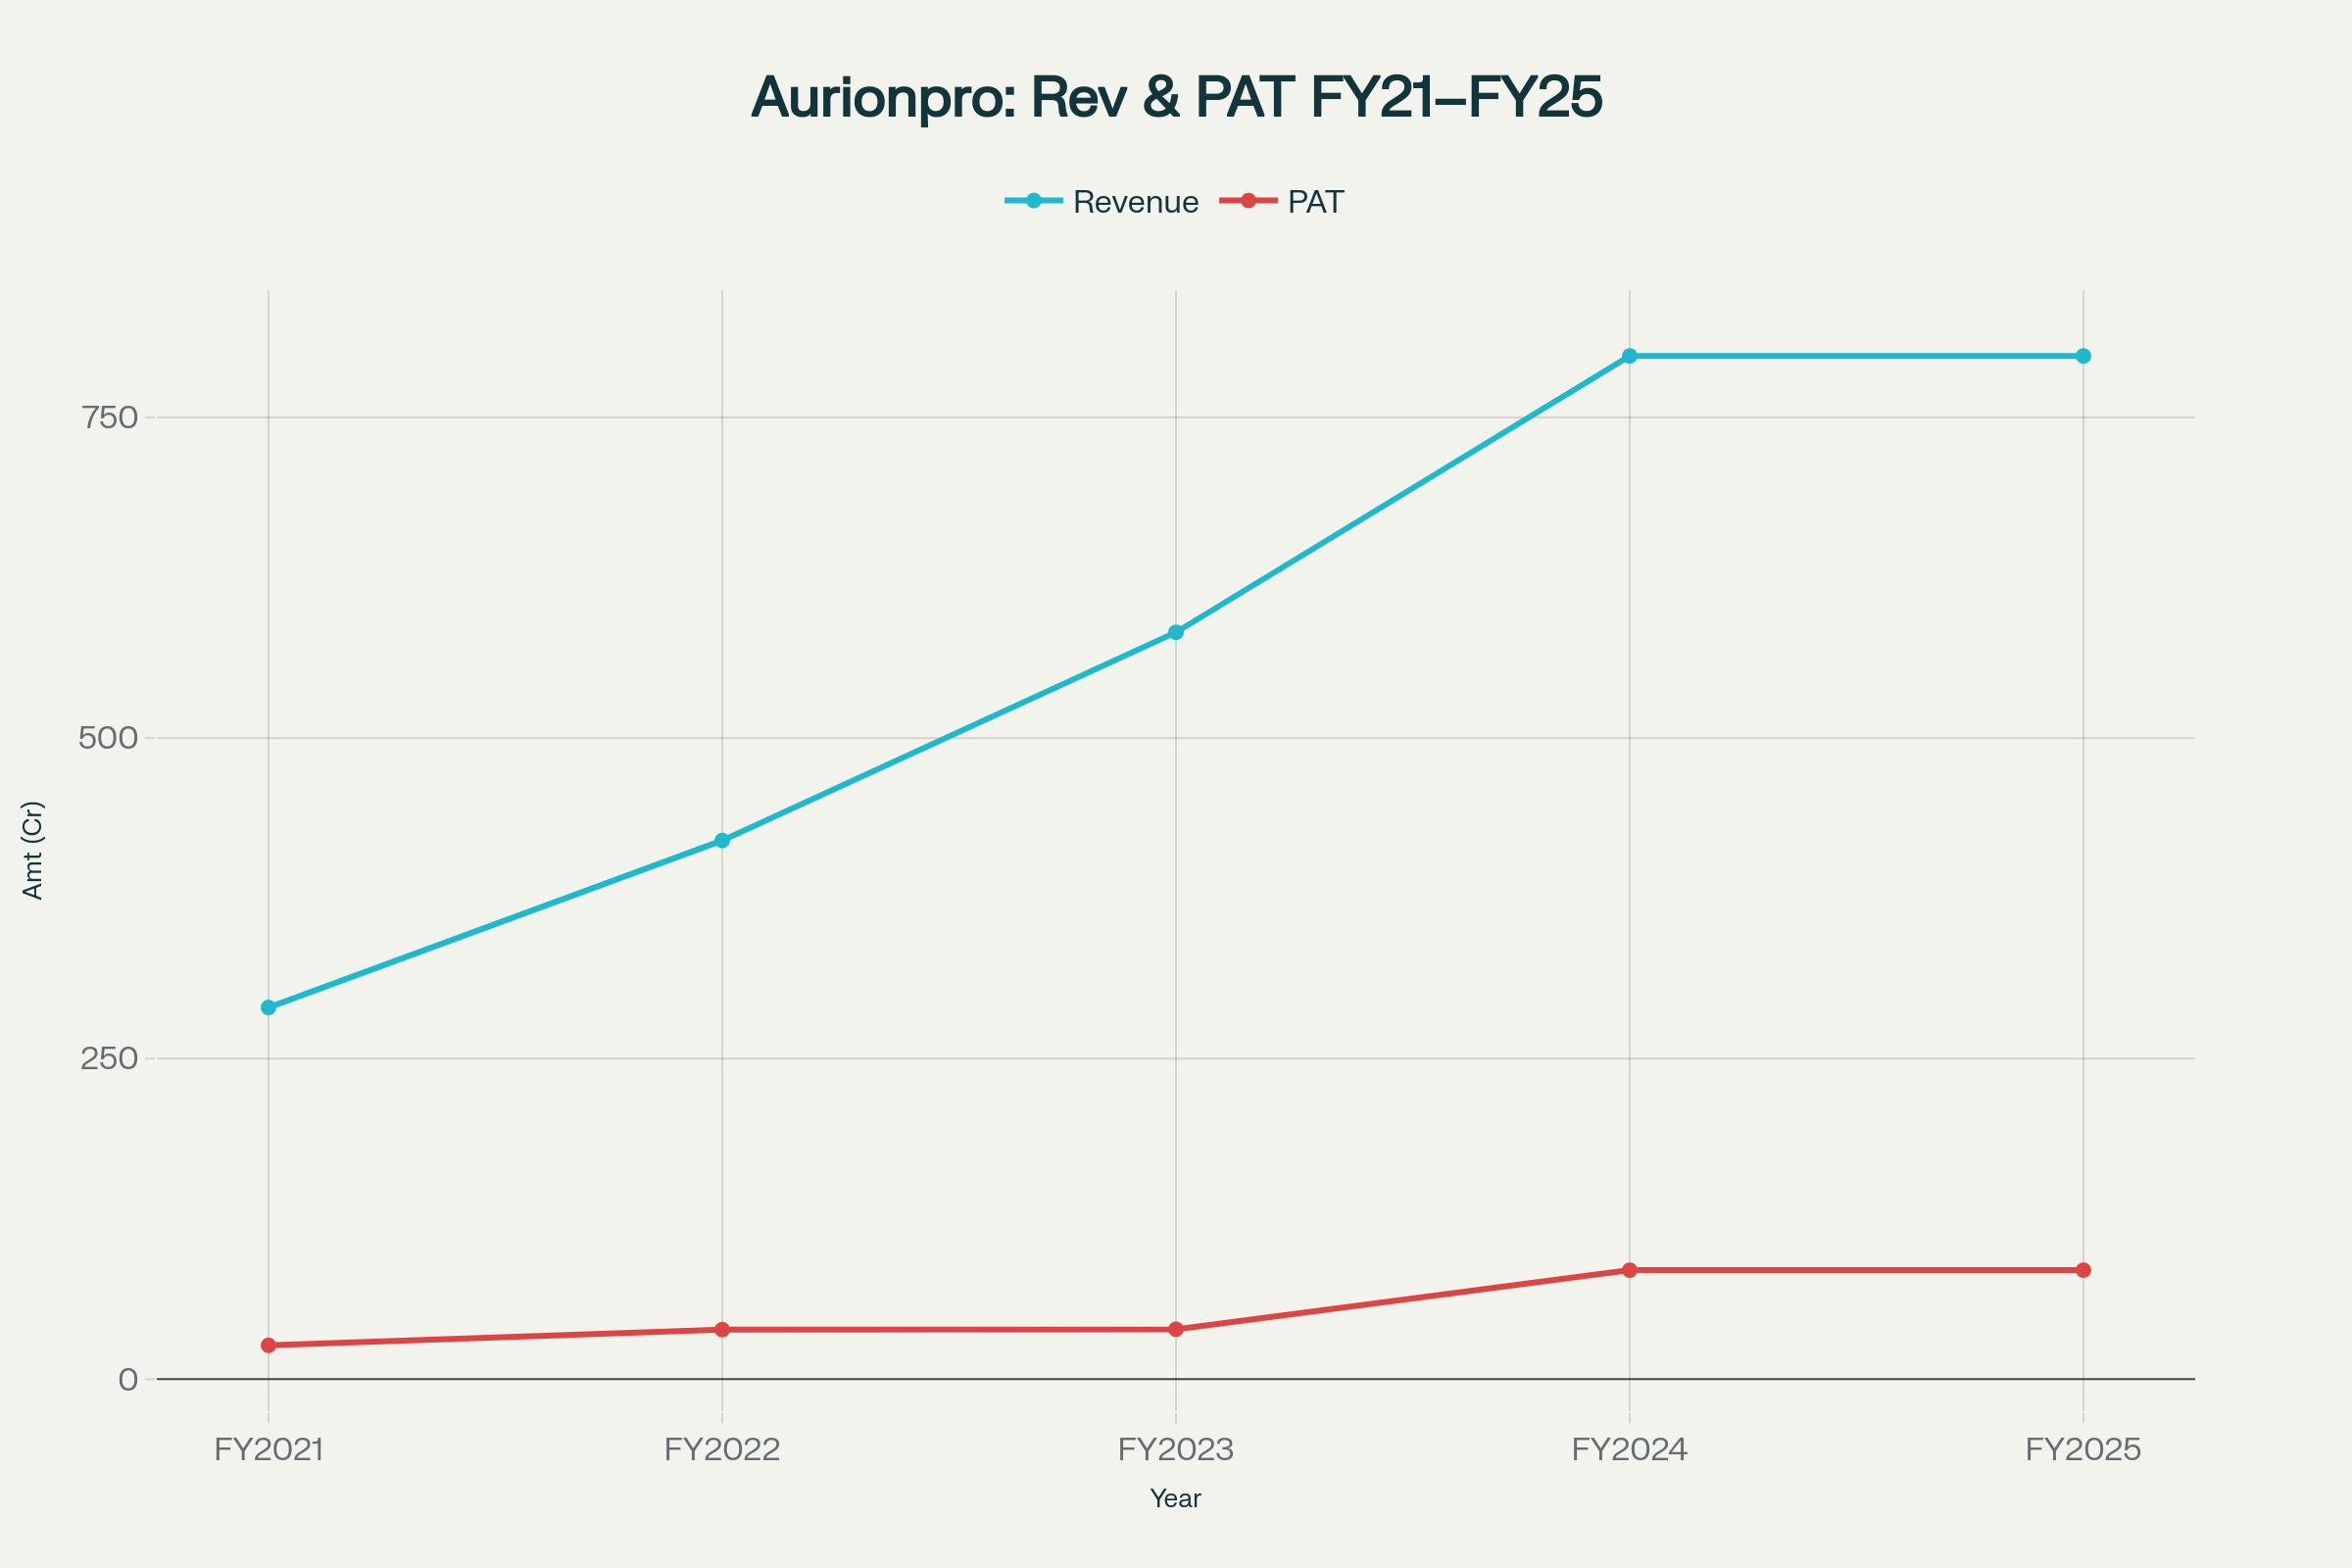
Aurionpro Solutions: Revenue and PAT (FY2021–FY2025)
Figure 2: Aurionpro Solutions – Revenue and PAT (FY 2021–FY 2025)
| Fiscal Year | Revenue (₹ Cr) | PAT (₹ Cr) | P/E (x) |
|---|---|---|---|
| FY 2021 | 289.88 | 26.38 | – |
| FY 2022 | 420.10 | 38.61 | – |
| FY 2023 | 582.49 | 38.90 | – |
| FY 2024 | 798.04 | 85.02 | 39.50 |
| FY 2025(TTM) | 798.04 | 85.02 | 39.50 |
Market Position and Industry Context
With digital penetration in logistics at ~15%, Aurionpro serves top express carriers and 3PLs in India and Southeast Asia. Its addressable market (~US $ 200 Bn) is under-penetrated, offering significant scope for growth through SaaS models and geographies (MENA).
Growth Strategy and Capacity Expansion
- SaaS Modules: Rolling out cold-chain and warehouse management suite.
- Geographic Expansion: Targeting MENA regions via partnerships.
- AI Roadmap: Integrating explainable AI features to comply with EU AI Act for finance clients.
Investment Highlights and Valuation
- Consistent Growth: 31–35% revenue CAGR FY 2021–24.
- Margin Improvement: PAT margin rose from 9% in FY 2021 to 16% in FY 2024.
- Valuation: EV/EBITDA ~12–14× reflects mid-cap software growth premium.
- Risks: R&D monetisation delays, high PE of ~40×, and product lifecycle obsolescence.
International Gemological Institute (India) Ltd
Company Overview and Business Model
IGI is India’s largest and the world’s second-largest independent gem certification body, with 31 global labs and ~65% share in lab-grown diamond certification. It offers natural and lab-grown diamond grading, jewelry appraisal, and gemological education, serving manufacturers, retailers, and end consumers.
Financial Overview
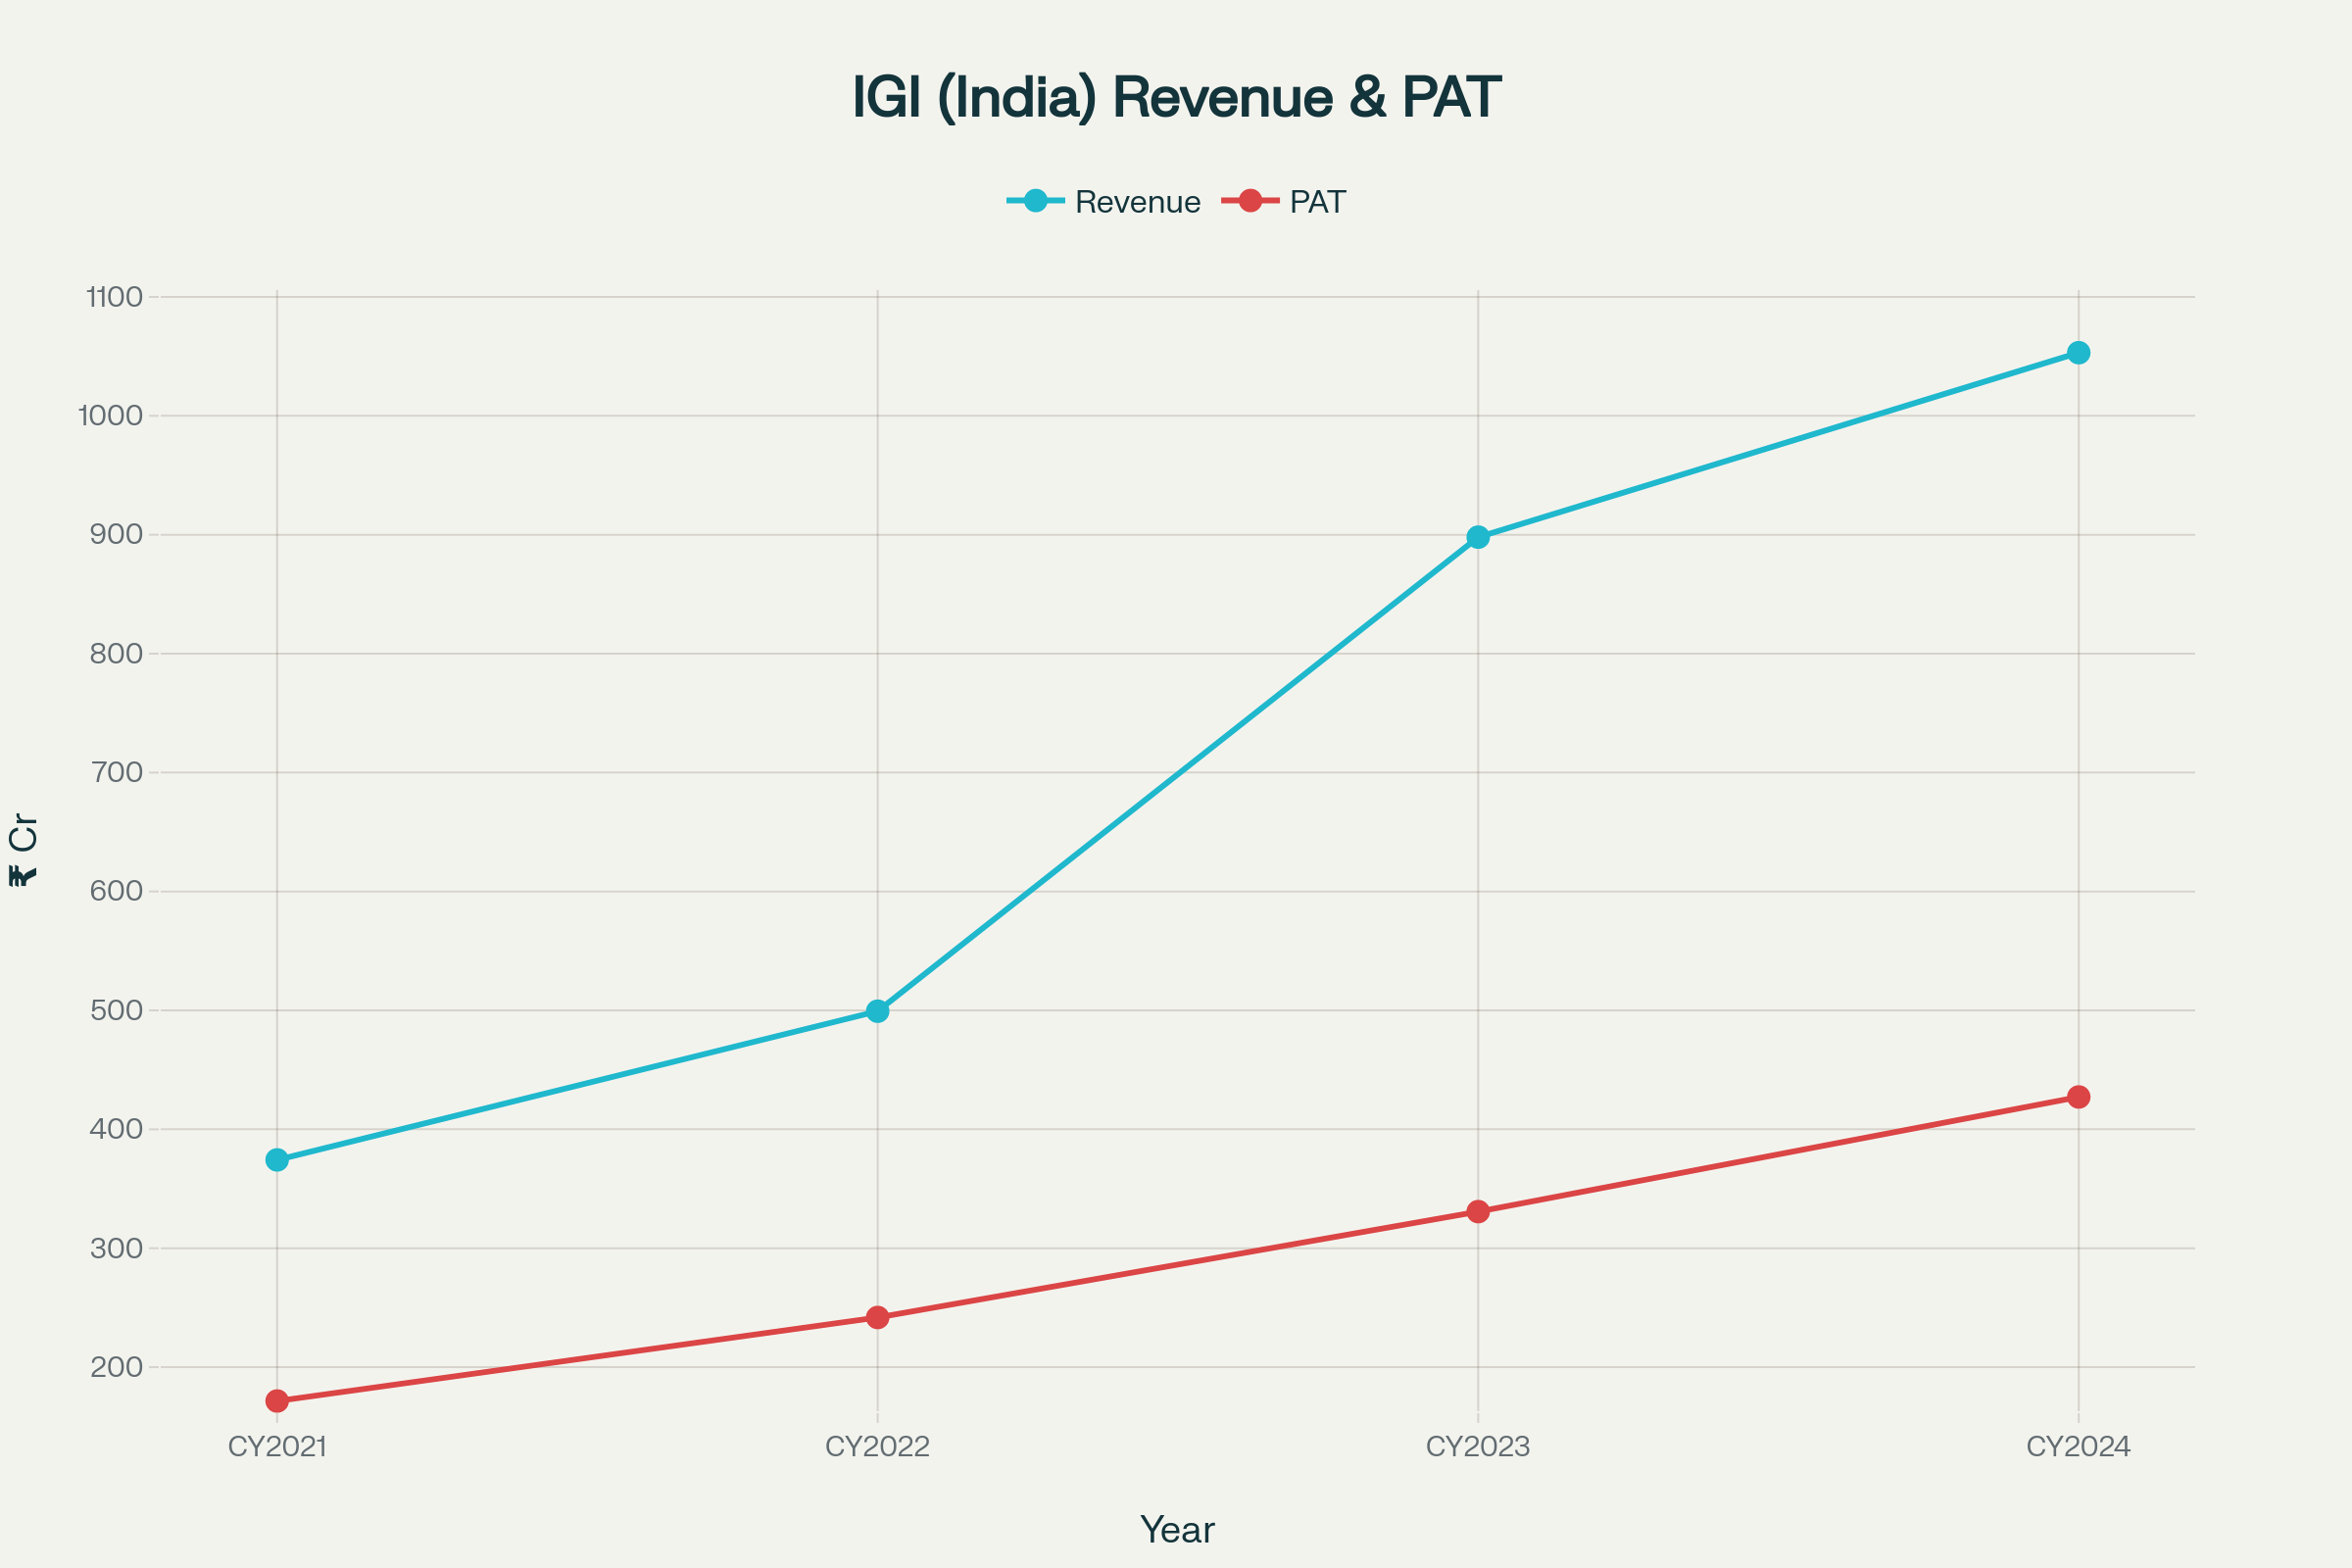
IGI: Revenue and PAT (CY2021–CY2024)
Figure 3: IGI – Revenue and PAT (CY 2021–CY 2024)
| Calendar Year | Revenue (₹ Cr) | PAT (₹ Cr) | P/E (x) |
|---|---|---|---|
| CY 2021 | 374.29 | 171.53 | – |
| CY 2022 | 499.33 | 241.76 | – |
| CY 2023 | 898.00 | 330.80 | 51.0 (IPO) |
| CY 2024 | 1053.10 | 427.20 | 40.95 |
Market Position and Industry Context
IGI commands ~50% of India’s certification market and ~33% global share in diamond grading by number of certificates. The global gem certification market (~US $ 600 Mn) is forecast to double by 2030 at 9–13% CAGR, driven by lab-grown adoption rising from 11% to 15% of the diamond market by 2028.
Growth Strategy and Capacity Expansion
- Global Lab Network: Post-IPO acquisitions expand footprint in Belgium and the Netherlands.
- Volume Upside: Lab-grown diamond certification volumes grew 27% YoY in CY 2024, now ~60% of India revenues.
- Service Innovation: Digital immersive reporting platforms to enhance consumer engagement.
Investment Highlights and Valuation
- Strong Metrics: EBITDA margin ~70%, ROCE ~70%, PAT margin 56% in CY 2024.
- Robust Growth: 42% revenue CAGR and 36% PAT CAGR over CY 2021–24.
- Valuation: P/E ~40–51× reflects leadership in a niche, high-visibility market.
- Risks: Reputation vs GIA grading discrepancies, technological advances in LGD affecting certification demand.
Disclaimer: This blog is solely for educational and informational purposes and does not constitute investment advice. All data is based on public filings and research.